Mapping CDR signals within Hvalfjörður 0: This notebook maps the fraction of CO2 uptake occuring within a finite regional domain using the global atlas estimates of uptake.
Import Libraries
Load the Python packages for data handling, ROMS-Tools grids, atlas utilities, and helper functions.
%load_ext autoreload
%autoreload 2

import numpy as np
import xarray as xr

import roms_tools as rt

import atlas_engine
/global/homes/m/mattlong/.conda/envs/cson-atlas/lib/python3.13/site-packages/pop_tools/__init__.py:4: UserWarning: pkg_resources is deprecated as an API. See https://setuptools.pypa.io/en/latest/pkg_resources.html. The pkg_resources package is slated for removal as early as 2025-11-30. Refrain from using this package or pin to Setuptools<81.
from pkg_resources import DistributionNotFound, get_distribution
Configure Inputs and Define the Regional Grid
domain_name = "test-dummy"
grid_yaml = "../tests/_grid.yml"
injection_year = 1999
injection_month = 1
n_test = 2
dask_cluster_kwargs = {
    "account": "m4632",
    "queue_name": "premium",
    "scheduler_file": None,
    "n_nodes": 1,
    "n_tasks_per_node": 128,
    "wallclock": "06:00:00",
}
# Parameters
domain_name = "Hvalfj\xf6r\xf0ur 0"
grid_yaml = "/global/u2/m/mattlong/codes/atlas-calcs/blueprints/cson_roms-marbl_v0.1_hvalfj\xf6r\xf0ur-0/_grid.yml"
injection_year = 1999
injection_month = 1
n_test = None
dask_cluster_kwargs = {
"account": "m4632",
"queue_name": "premium",
"n_nodes": 1,
"n_tasks_per_node": 128,
"wallclock": "06:00:00",
"scheduler_file": "/pscratch/sd/m/mattlong/dask/dask_scheduler_file.zfw_w4vl.json",
}
Configure Inputs and Define the Regional Grid
Set the domain name, grid YAML, injection settings, and optional n_test parameter, then load the ROMS-Tools grid. The grid defines the spatial boundaries of the regional domain and is plotted for a quick visual check.
model_grid = atlas_engine.parsers.load_roms_tools_object(grid_yaml)
model_grid.plot()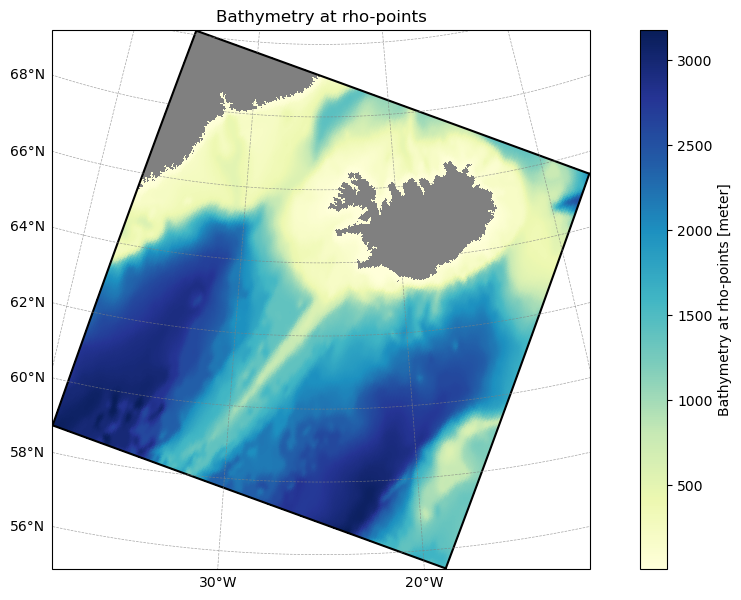
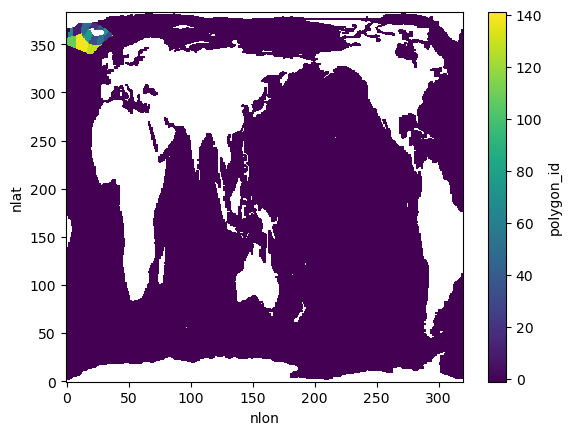
Create Analyzer and Identify Overlapping Polygons
Select the atlas dataset spec from cdr_atlas.DATASET_REGISTRY and initialize AtlasModelGridAnalyzer. The analyzer:
Computes a convex hull of the regional grid using
model_grid.ds.lat_u/lon_uPerforms point‑in‑polygon tests against the atlas grid
Extracts unique polygon IDs that overlap the regional domain
Builds a polygon mask for within‑domain points
This convex‑hull approach captures non‑rectangular domains more accurately than a bounding box.
atlas_data = atlas_engine.datasets["oae-efficiency-map_atlas-v0"]

# Create AtlasModelGridAnalyzer instance
analyzer = atlas_data.analyzer(model_grid)

# Get polygon IDs within model grid boundaries
print(f"Found {len(analyzer.polygon_ids_in_bounds)} unique polygon IDs within model grid boundaries")
print(f"Polygon IDs: {analyzer.polygon_ids_in_bounds[:100]}..." if len(analyzer.polygon_ids_in_bounds) > 100 else f"Polygon IDs: {analyzer.polygon_ids_in_bounds}")

analyzer.polygon_id_mask.plot(vmin=-1, vmax=analyzer.polygon_id_mask.max())
Found 15 unique polygon IDs within model grid boundaries
Polygon IDs: [ 9. 18. 30. 32. 36. 48. 52. 65. 71. 77. 108. 115. 128. 138.
141.]
Start Dask Cluster and Test a Single Polygon
A Dask cluster is created (if available) for distributed operations. Then we compute cumulative CO2 uptake for a single polygon using n_test=3, which limits the analysis to the first three files in the atlas sequence.
The integration:
Ensures cached files via the dataset spec
Calculates the additional CO2 flux (
FG_CO2 - FG_ALT_CO2)Integrates over space and time using:
Area weighting with
TAREATime weighting with days per month
Spatial masking to the regional domain
Computes cumulative integrals over elapsed time
The outputs include total uptake, uptake within the regional grid, and the fraction captured.
cluster = atlas_engine.dask_cluster(**dask_cluster_kwargs)
cluster
Dashboard:
https://jupyter.nersc.gov/user/mattlong/perlmutter-login-node-base/proxy/10.249.14.169:8787/status
/global/homes/m/mattlong/.conda/envs/cson-atlas/lib/python3.13/site-packages/distributed/client.py:1596: VersionMismatchWarning: Mismatched versions found

+-------------+----------+-----------+-----------+
| Package     | Client   | Scheduler | Workers   |
+-------------+----------+-----------+-----------+
| dask        | 2026.1.1 | 2025.12.0 | 2025.12.0 |
| distributed | 2026.1.1 | 2025.12.0 | 2025.12.0 |
+-------------+----------+-----------+-----------+
  warnings.warn(version_module.VersionMismatchWarning(msg[0]["warning"]))
<atlas_engine.utils.dask_cluster at 0x7fed34f506e0>%%time
# Integrate FG_CO2 for polygon 000 using the first 3 files in the sequence
results = analyzer.integrate_fg_co2_polygon_by_id(
polygon_id=analyzer.polygon_ids_in_bounds[-1],
injection_year=injection_year,
injection_month=injection_month,
n_test=3,
)
print("FG_CO2 Integration Results:")
print(f" Total integrated FG_CO2: {results['total'].values[-1]:.2e}")
print(f" Within model grid: {results['within_grid'].values[-1]:.2e}")
print(f" Fraction within grid: {results['fraction'].values[-1]:.2%}")FG_CO2 Integration Results:
Total integrated FG_CO2: 2.00e+10
Within model grid: 6.75e+08
Fraction within grid: 3.38%
CPU times: user 2.61 s, sys: 349 ms, total: 2.95 s
Wall time: 3.62 s
Integrate CO2 Flux for All Overlapping Polygons
Compute cumulative CO2 uptake for every polygon that overlaps the regional domain. Results are concatenated along polygon_id, yielding a dataset with dimensions (polygon_id, elapsed_time).
%%time
ds = analyzer.integrate_fg_co2_polygons_within_boundaries(
    injection_year=injection_year,
    injection_month=injection_month,
    n_test=n_test,
)
ds
CPU times: user 1min 31s, sys: 6.07 s, total: 1min 37s
Wall time: 2min 45s
Visualize Fraction of Uptake within the Regional Domain
Map the fraction of CO2 uptake captured within the regional domain for each polygon. The map highlights where a larger share of uptake falls inside the regional grid, helping assess how well the regional domain captures atlas signals.
ds_out = analyzer.set_field_within_boundaries(ds.fraction.isel(elapsed_time=-1))
ds_out.to_zarr(
    atlas_engine.paths.scratch / f"{domain_name.replace(' ', '-')}_fraction_within_boundaries.zarr",
    mode="w",
    consolidated=True,
)
/global/homes/m/mattlong/.conda/envs/cson-atlas/lib/python3.13/site-packages/zarr/api/asynchronous.py:247: ZarrUserWarning: Consolidated metadata is currently not part in the Zarr format 3 specification. It may not be supported by other zarr implementations and may change in the future.
  warnings.warn(
<xarray.backends.zarr.ZarrStore at 0x7fe8c962c9a0>ds_out.plot(cmap="RdBu_r", vmin=0, vmax=1)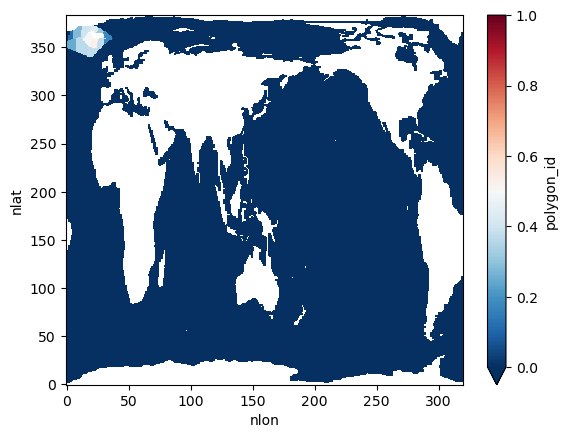
# check if LocalCluster is running and shutdown
if cluster.local_cluster:
    cluster.shutdown()