Passive Tracer (SF6) in Model
This notebook compares modeled passive dye from Iceland2 with the observed SF₆ tracer in Hvalfjörður.
Model dye fields: Load Iceland2 dye output, regrid to lon/lat, and apply a scaling to match the observed maximum concentration.
Like-for-like diagnostics: Sample the model at observation locations and compute daily binned longitudinal distributions.
Plume centroids: Compare mass-weighted plume positions and their evolution for model vs observations.
Use this to assess how well the passive dye simulation reproduces the observed SF₆ plume dispersion.
# SF₆ / dye model comparison


import subprocess
import os
import pandas as pd
import netCDF4
import numpy as np
import glob
import time
import matplotlib.pyplot as plt
import copy
import xarray as xr
from datetime import datetime, timedelta
import dask
from scipy.interpolate import griddata
#from ocean_c_lab_tools import *
#from celluloid import Camera
#import PyCO2SYS as csys
import seawater as sw
import sys
import os

# Add parent directory to Python path
sys.path.append(os.path.abspath(".."))
from roms_regrid import *
import cartopy.crs as ccrs
from cartopy.mpl.gridliner import LONGITUDE_FORMATTER, LATITUDE_FORMATTER
xls = pd.ExcelFile('../../data/20241119_combined_data.xlsx')


combo = pd.read_excel(xls, '20241119_combined_data',decimal='.')
combo
Loading...
obs=xr.Dataset.from_dataframe(combo)
obs=obs.set_index(index=['Date','Obs_no'])
#obs=obs.drop_duplicates('index')
obs=obs.unstack('index')
#obs=obs.rename(name_dict={'mon/day/yr':'time','Depth':'depth','Latitude(°N)':'lat','Longitude(°E)':'lon'})
import numpy as np

def get_daily_locations(obs_ds):
    dates = obs_ds['Date'].values
    num_days = len(dates)
    num_obs = obs_ds.dims['Obs_no']

    # Initialize empty array: (days, obs, 2)
    locations = np.empty((num_days, num_obs, 2))

    for i in range(0,num_days):
        lat = obs_ds['Lat'].isel(Date=i).values
        lon = obs_ds['Long'].isel(Date=i).values + 360  # convert to 0–360 range
        locations[i, :, 0] = lat
        locations[i, :, 1] = lon

    return locations

# Example usage
locations_array = get_daily_locations(obs)
print("Shape of locations array:", locations_array.shape)  # should be (9, 2729, 2)
Shape of locations array: (9, 2729, 2)
/tmp/ipykernel_1795737/1794326622.py:6: FutureWarning: The return type of `Dataset.dims` will be changed to return a set of dimension names in future, in order to be more consistent with `DataArray.dims`. To access a mapping from dimension names to lengths, please use `Dataset.sizes`.
  num_obs = obs_ds.dims['Obs_no']
max_sf=np.max(obs['SF6 (fmol/L)'].isel(Date=1))
#x=xr.open_mfdataset('/pscratch/sd/u/uheede/from_expanse/Iceland3/*', combine='nested', concat_dim=["time"])
# open dataset
x=xr.open_mfdataset('/home/x-uheede/S/Iceland2_NOMARBL_2024_DYE_2/Iceland2_MARBL_2024_his.20240717130000.nc', combine='nested', concat_dim=["time"])

# open grid
grid=xr.open_mfdataset('/home/x-uheede/S/Iceland2_NOMARBL_2024_DYE_2/P_INPUT/Iceland2_grid.nc')

x_mean=x.isel(s_rho=slice(50,59)).mean('s_rho').isel(time=slice(0,24)).mean('time')

dye=x_mean['dye']


# regridding
dye=roms_regrid(grid,dye)

mask=roms_regrid(grid,grid['mask_rho'])
#t=t.where(t != 0)
#s=s.where(s != 0)
;
/home/x-uheede/.local/lib/python3.11/site-packages/xarray/computation/apply_ufunc.py:310: PerformanceWarning: Regridding is increasing the number of chunks by a factor of 9.0, you might want to specify sizes in `output_chunks` in the regridder call. Default behaviour is to preserve the chunk sizes from the input (172, 172).
  result_var = func(*data_vars)
''import xarray as xr
import numpy as np
# Open dataset
x = xr.open_mfdataset(
'/home/x-uheede/S/Iceland2_NOMARBL_2024_DYE_2/Iceland2_MARBL_2024_his.202407????????.nc',
combine='nested',
concat_dim=["time"]
)
# Compute global max of dye (ignoring NaNs)
dye_max = (
x['dye']
.max(dim=['time', 's_rho', 'eta_rho', 'xi_rho'], skipna=True)
.compute()
.item()
)
target_max = 29293.88
scaling_factor = target_max / dye_max
#scaling_factor=97.09
print(f"Current max dye: {dye_max:.6f}")
print(f"Scaling factor: {scaling_factor:.6f}")
Current max dye: 100.000000
Scaling factor: 292.938800
dye.load()
;
''import numpy as np
# seconds since reference
ot = x['ocean_time']
# hour of day [0–23]
hour_of_day = ((ot % 86400) // 3600).astype(int)
# day index starting at 0
day_index = (ot // 86400).astype(int)
from matplotlib.colors import LogNorm
unique_days = np.unique(day_index.values)
num_days = 9
vmin, vmax = 1e-1, 5e4
fig, axs = plt.subplots(
nrows=num_days,
figsize=(6, 2.5 * num_days),
dpi=200,
subplot_kw={'projection': ccrs.Mercator()}
)
for d, day in enumerate(unique_days[:num_days]):
day_mask = (day_index == day)
if d == 0:
hour_mask = (hour_of_day >= 17) & (hour_of_day < 19)
title_hours = "17–19"
else:
hour_mask = (hour_of_day >= 9) & (hour_of_day < 18)
title_hours = "09–18"
time_mask = day_mask & hour_mask
time_idx = np.where(time_mask.values)[0]
if len(time_idx) == 0:
continue
x_day = (
x
.isel(time=time_idx)
.isel(s_rho=slice(50, 59))
.mean(dim=['time', 's_rho'])
)
dye = roms_regrid(grid, x_day['dye']).load()
# -----------------------
# Extract dye at locations
# -----------------------
dye_values, lats, lons = [], [], []
clean_locs = locations_array[d, :, :]
locations = clean_locs[~np.isnan(clean_locs).any(axis=1)]
for lat, lon in locations:
val = (
dye
.sel(lat=lat, method='nearest')
.sel(lon=lon, method='nearest')
.values
* scaling_factor
)
dye_values.append(val)
lats.append(lat)
lons.append(lon)
ax = axs[d]
ax.contourf(
mask.lon, mask.lat, mask.load(),
transform=ccrs.PlateCarree(),
cmap='bone_r'
)
sc = ax.scatter(
lons, lats,
c=dye_values,
cmap='jet',
s=5,
norm=LogNorm(vmin=vmin, vmax=vmax),
transform=ccrs.PlateCarree()
)
ax.set_extent(
[-22.2, -21.3, 64.225, 64.424], # [lon_min, lon_max, lat_min, lat_max]
crs=ccrs.PlateCarree()
)
# Add gridlines
gl = ax.gridlines(crs=ccrs.PlateCarree(), draw_labels=True,
linewidth=1, color='gray', alpha=0.5, linestyle='--')
gl.top_labels = False
gl.right_labels = False
gl.xlines = False
gl.ylines = False
gl.xformatter = LONGITUDE_FORMATTER
gl.yformatter = LATITUDE_FORMATTER
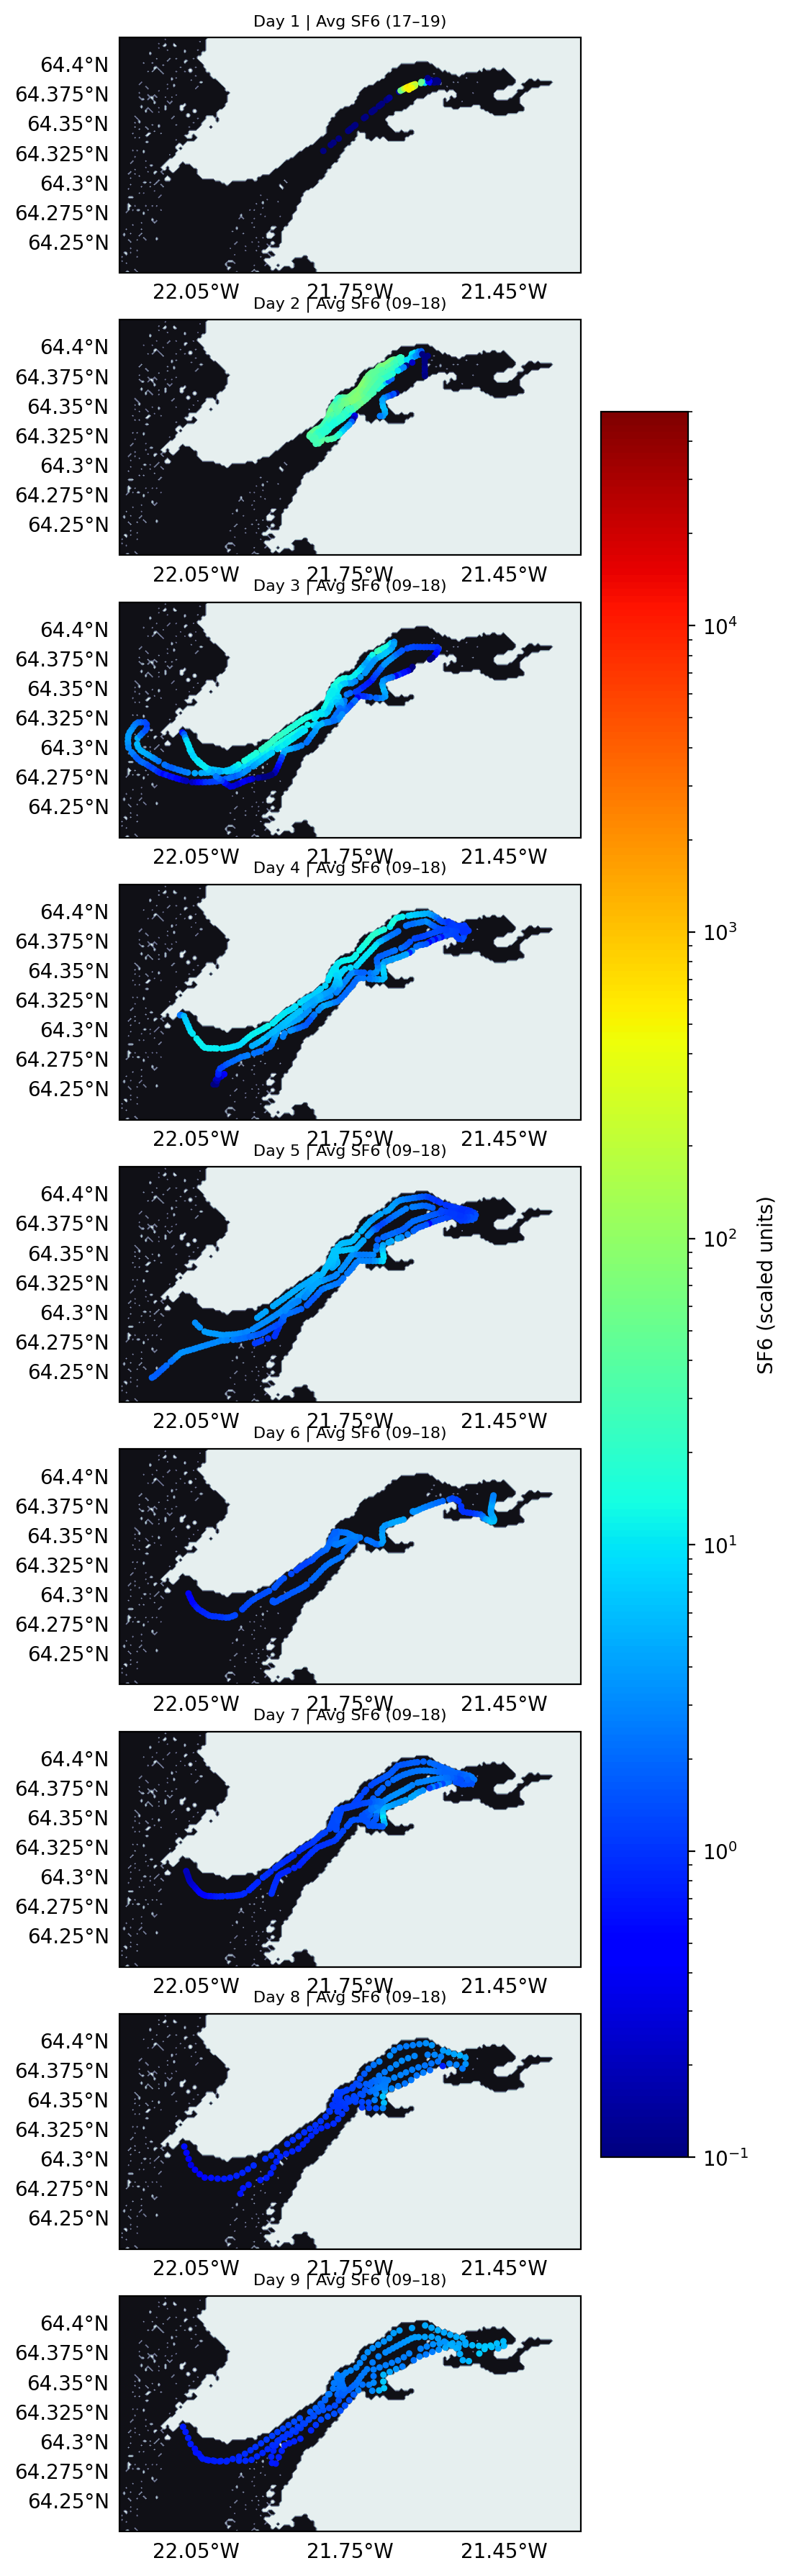
ax.set_title(f"Day {d+1} | Avg SF6 ({title_hours})", fontsize=8)
# Shared colorbar for all days
cbar = fig.colorbar(
sc,
ax=axs,
orientation='vertical',
shrink=0.7,
pad=0.03
)
cbar.set_label('SF6 (scaled units)')
/home/x-uheede/.local/lib/python3.11/site-packages/xarray/computation/apply_ufunc.py:310: PerformanceWarning: Regridding is increasing the number of chunks by a factor of 9.0, you might want to specify sizes in `output_chunks` in the regridder call. Default behaviour is to preserve the chunk sizes from the input (172, 172).
  result_var = func(*data_vars)
from matplotlib.colors import LogNorm
import matplotlib.pyplot as plt
import cartopy.crs as ccrs
import numpy as np
scaling_factor=1600
unique_days = np.unique(day_index.values)
num_panels = 9
vmin, vmax = 1e-1, 5e4
fig, axs = plt.subplots(
nrows=3, ncols=3,
figsize=(10, 10),
dpi=200,
subplot_kw={'projection': ccrs.Mercator()},
gridspec_kw={'wspace': 0.04, 'hspace': 0.04}
)
axs = axs.flatten()
for d in range(num_panels):
ax = axs[d]
if d >= len(unique_days):
ax.axis('off')
continue
day = unique_days[d]
day_mask = (day_index == day)
if d == 0:
hour_mask = (hour_of_day >= 17) & (hour_of_day < 19)
title_hours = "17–19"
else:
hour_mask = (hour_of_day >= 9) & (hour_of_day < 18)
title_hours = "09–18"
time_mask = day_mask & hour_mask
time_idx = np.where(time_mask.values)[0]
if len(time_idx) == 0:
ax.axis('off')
continue
x_day = (
x
.isel(time=time_idx)
.isel(s_rho=slice(50, 59))
.mean(dim=['time', 's_rho'])
)
dye = roms_regrid(grid, x_day['dye']).load()
dye_values, lats, lons = [], [], []
clean_locs = locations_array[d, :, :]
locations = clean_locs[~np.isnan(clean_locs).any(axis=1)]
for lat, lon in locations:
val = (
dye
.sel(lat=lat, method='nearest')
.sel(lon=lon, method='nearest')
.values
* scaling_factor
)
dye_values.append(val)
lats.append(lat)
lons.append(lon)
# -----------------------
# Land mask
# -----------------------
ax.contourf(
mask.lon, mask.lat, mask.load(),
transform=ccrs.PlateCarree(),
cmap='bone'
)
sc = ax.scatter(
lons, lats,
c=dye_values,
cmap='jet',
s=6,
norm=LogNorm(vmin=vmin, vmax=vmax),
transform=ccrs.PlateCarree()
)
ax.set_extent(
[-22.2, -21.3, 64.225, 64.424],
crs=ccrs.PlateCarree()
)
# -----------------------
# Clean gridlines
# -----------------------
gl = ax.gridlines(draw_labels=False,
linewidth=0.5,
color='gray',
alpha=0.4,
linestyle='--')
# Left column latitude labels
if d % 3 == 0:
gl.left_labels = True
gl.yformatter = LATITUDE_FORMATTER
# Bottom row longitude labels
if d >= 6:
gl.bottom_labels = True
gl.xformatter = LONGITUDE_FORMATTER
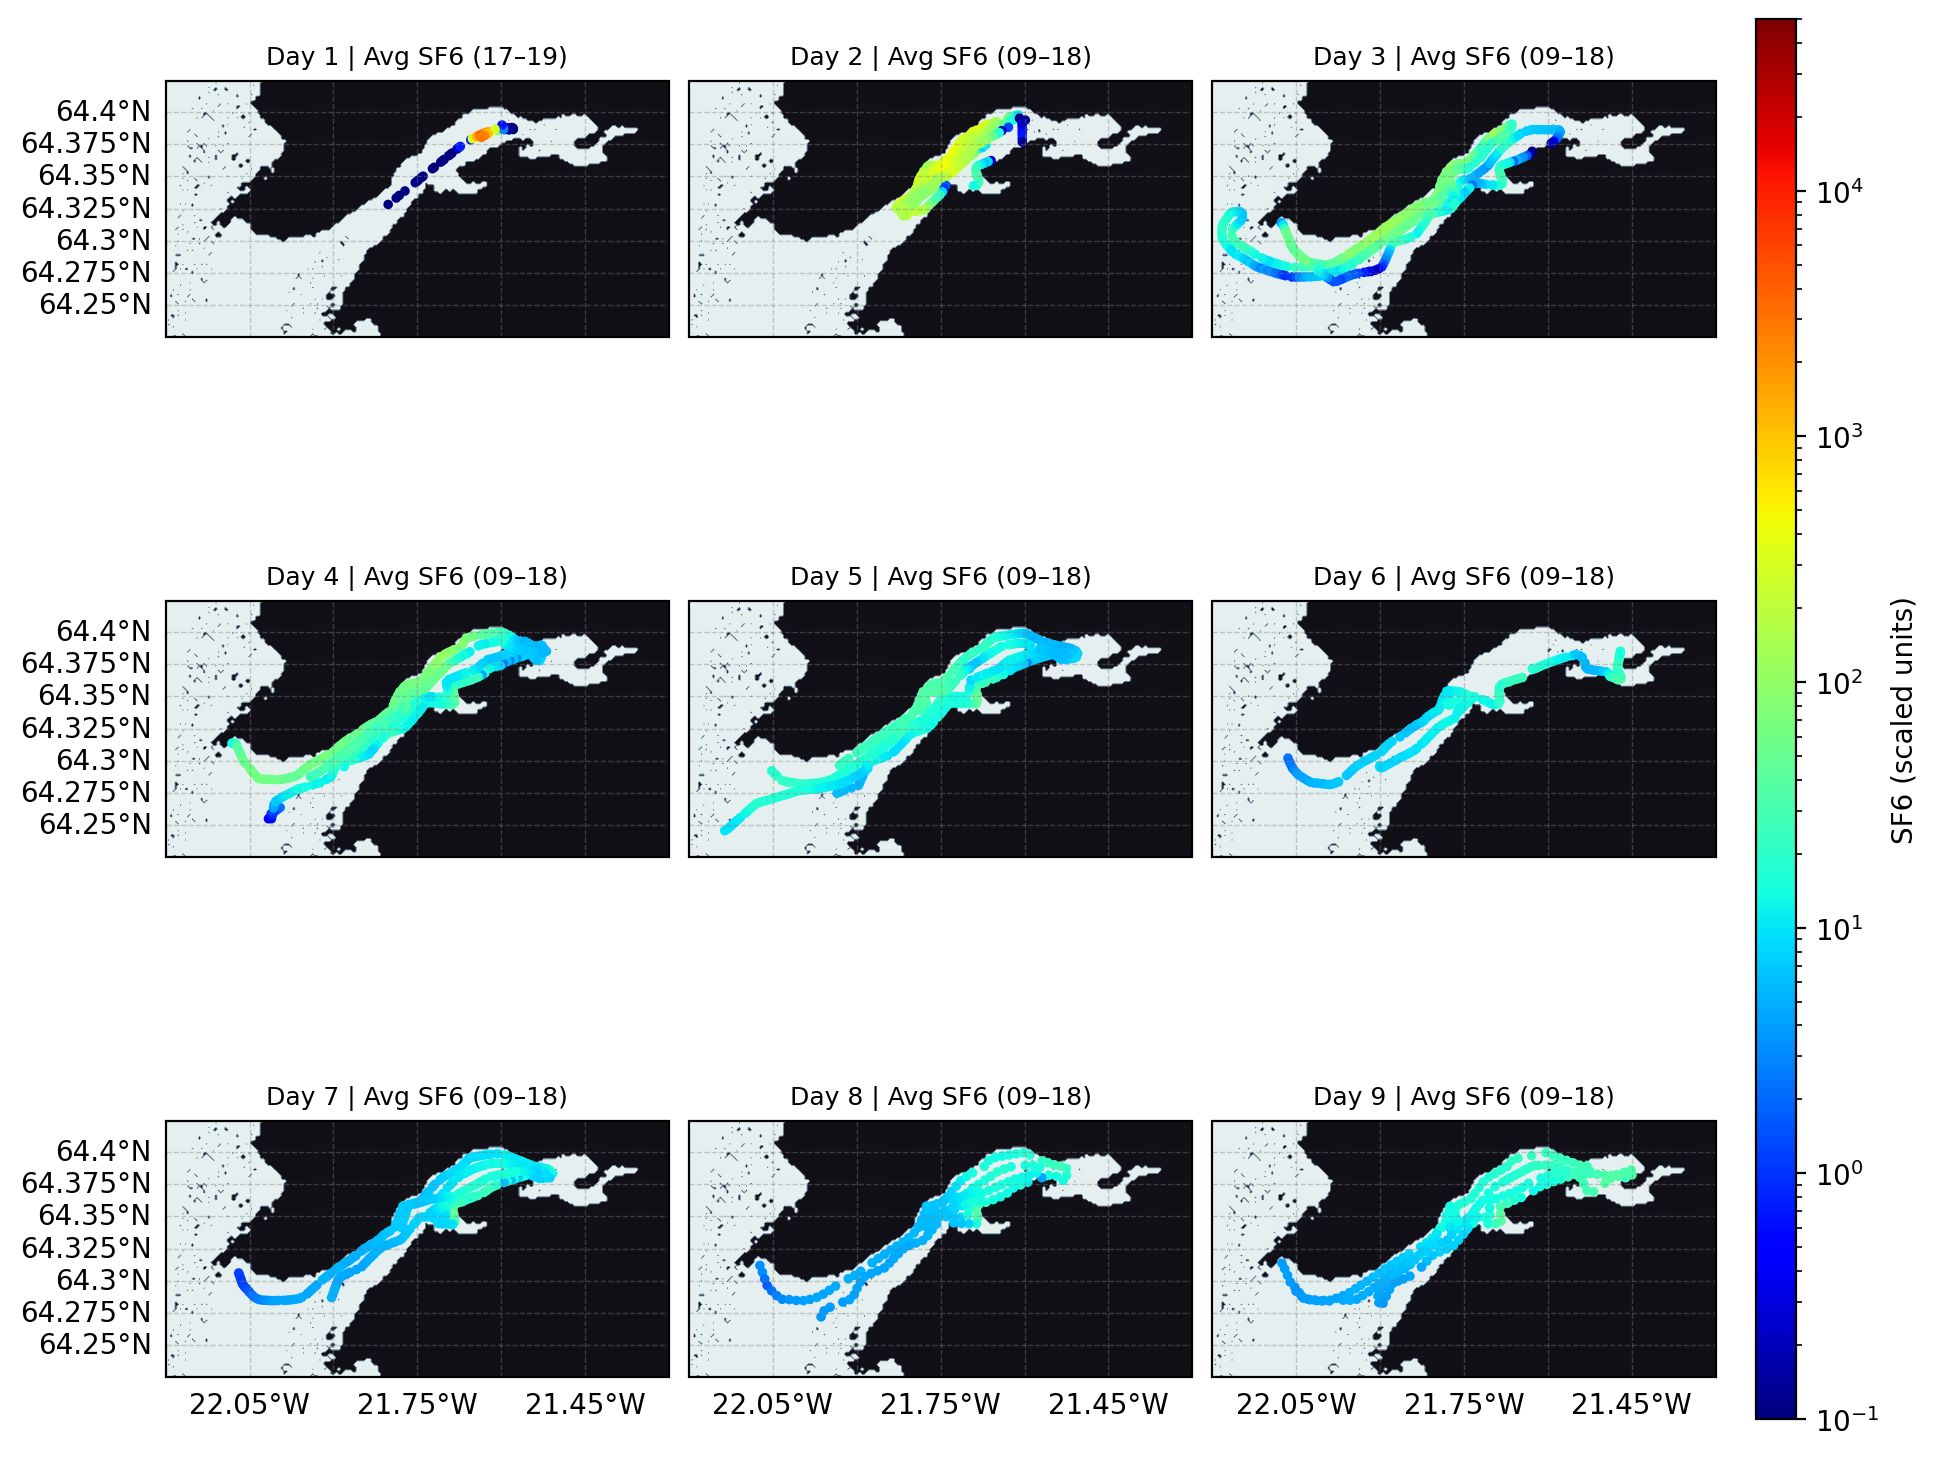
ax.set_title(f"Day {d+1} | Avg SF6 ({title_hours})", fontsize=9)
# -----------------------
# Dedicated colorbar axis
# -----------------------
cax = fig.add_axes([0.92, 0.15, 0.02, 0.7])
cbar = fig.colorbar(sc, cax=cax)
cbar.set_label('SF6 (scaled units)')
plt.show()
/home/x-uheede/.local/lib/python3.11/site-packages/xarray/computation/apply_ufunc.py:310: PerformanceWarning: Regridding is increasing the number of chunks by a factor of 9.0, you might want to specify sizes in `output_chunks` in the regridder call. Default behaviour is to preserve the chunk sizes from the input (172, 172).
  result_var = func(*data_vars)
x.ocean_time.load()
Loading...
import matplotlib.pyplot as plt
import numpy as np
import xarray as xr
scaling_factor=97.09
x = xr.open_mfdataset(
'/home/x-uheede/S/Iceland2_NOMARBL_2024_DYE_2/Iceland2_MARBL_2024_his.202407????????.nc',
combine='nested',
concat_dim=["time"]
)
# open grid
grid = xr.open_mfdataset(
'/home/x-uheede/S/Iceland2_NOMARBL_2024_DYE_2/P_INPUT/Iceland2_grid.nc'
)
# Constants
hours_per_day = 24
num_days = 7
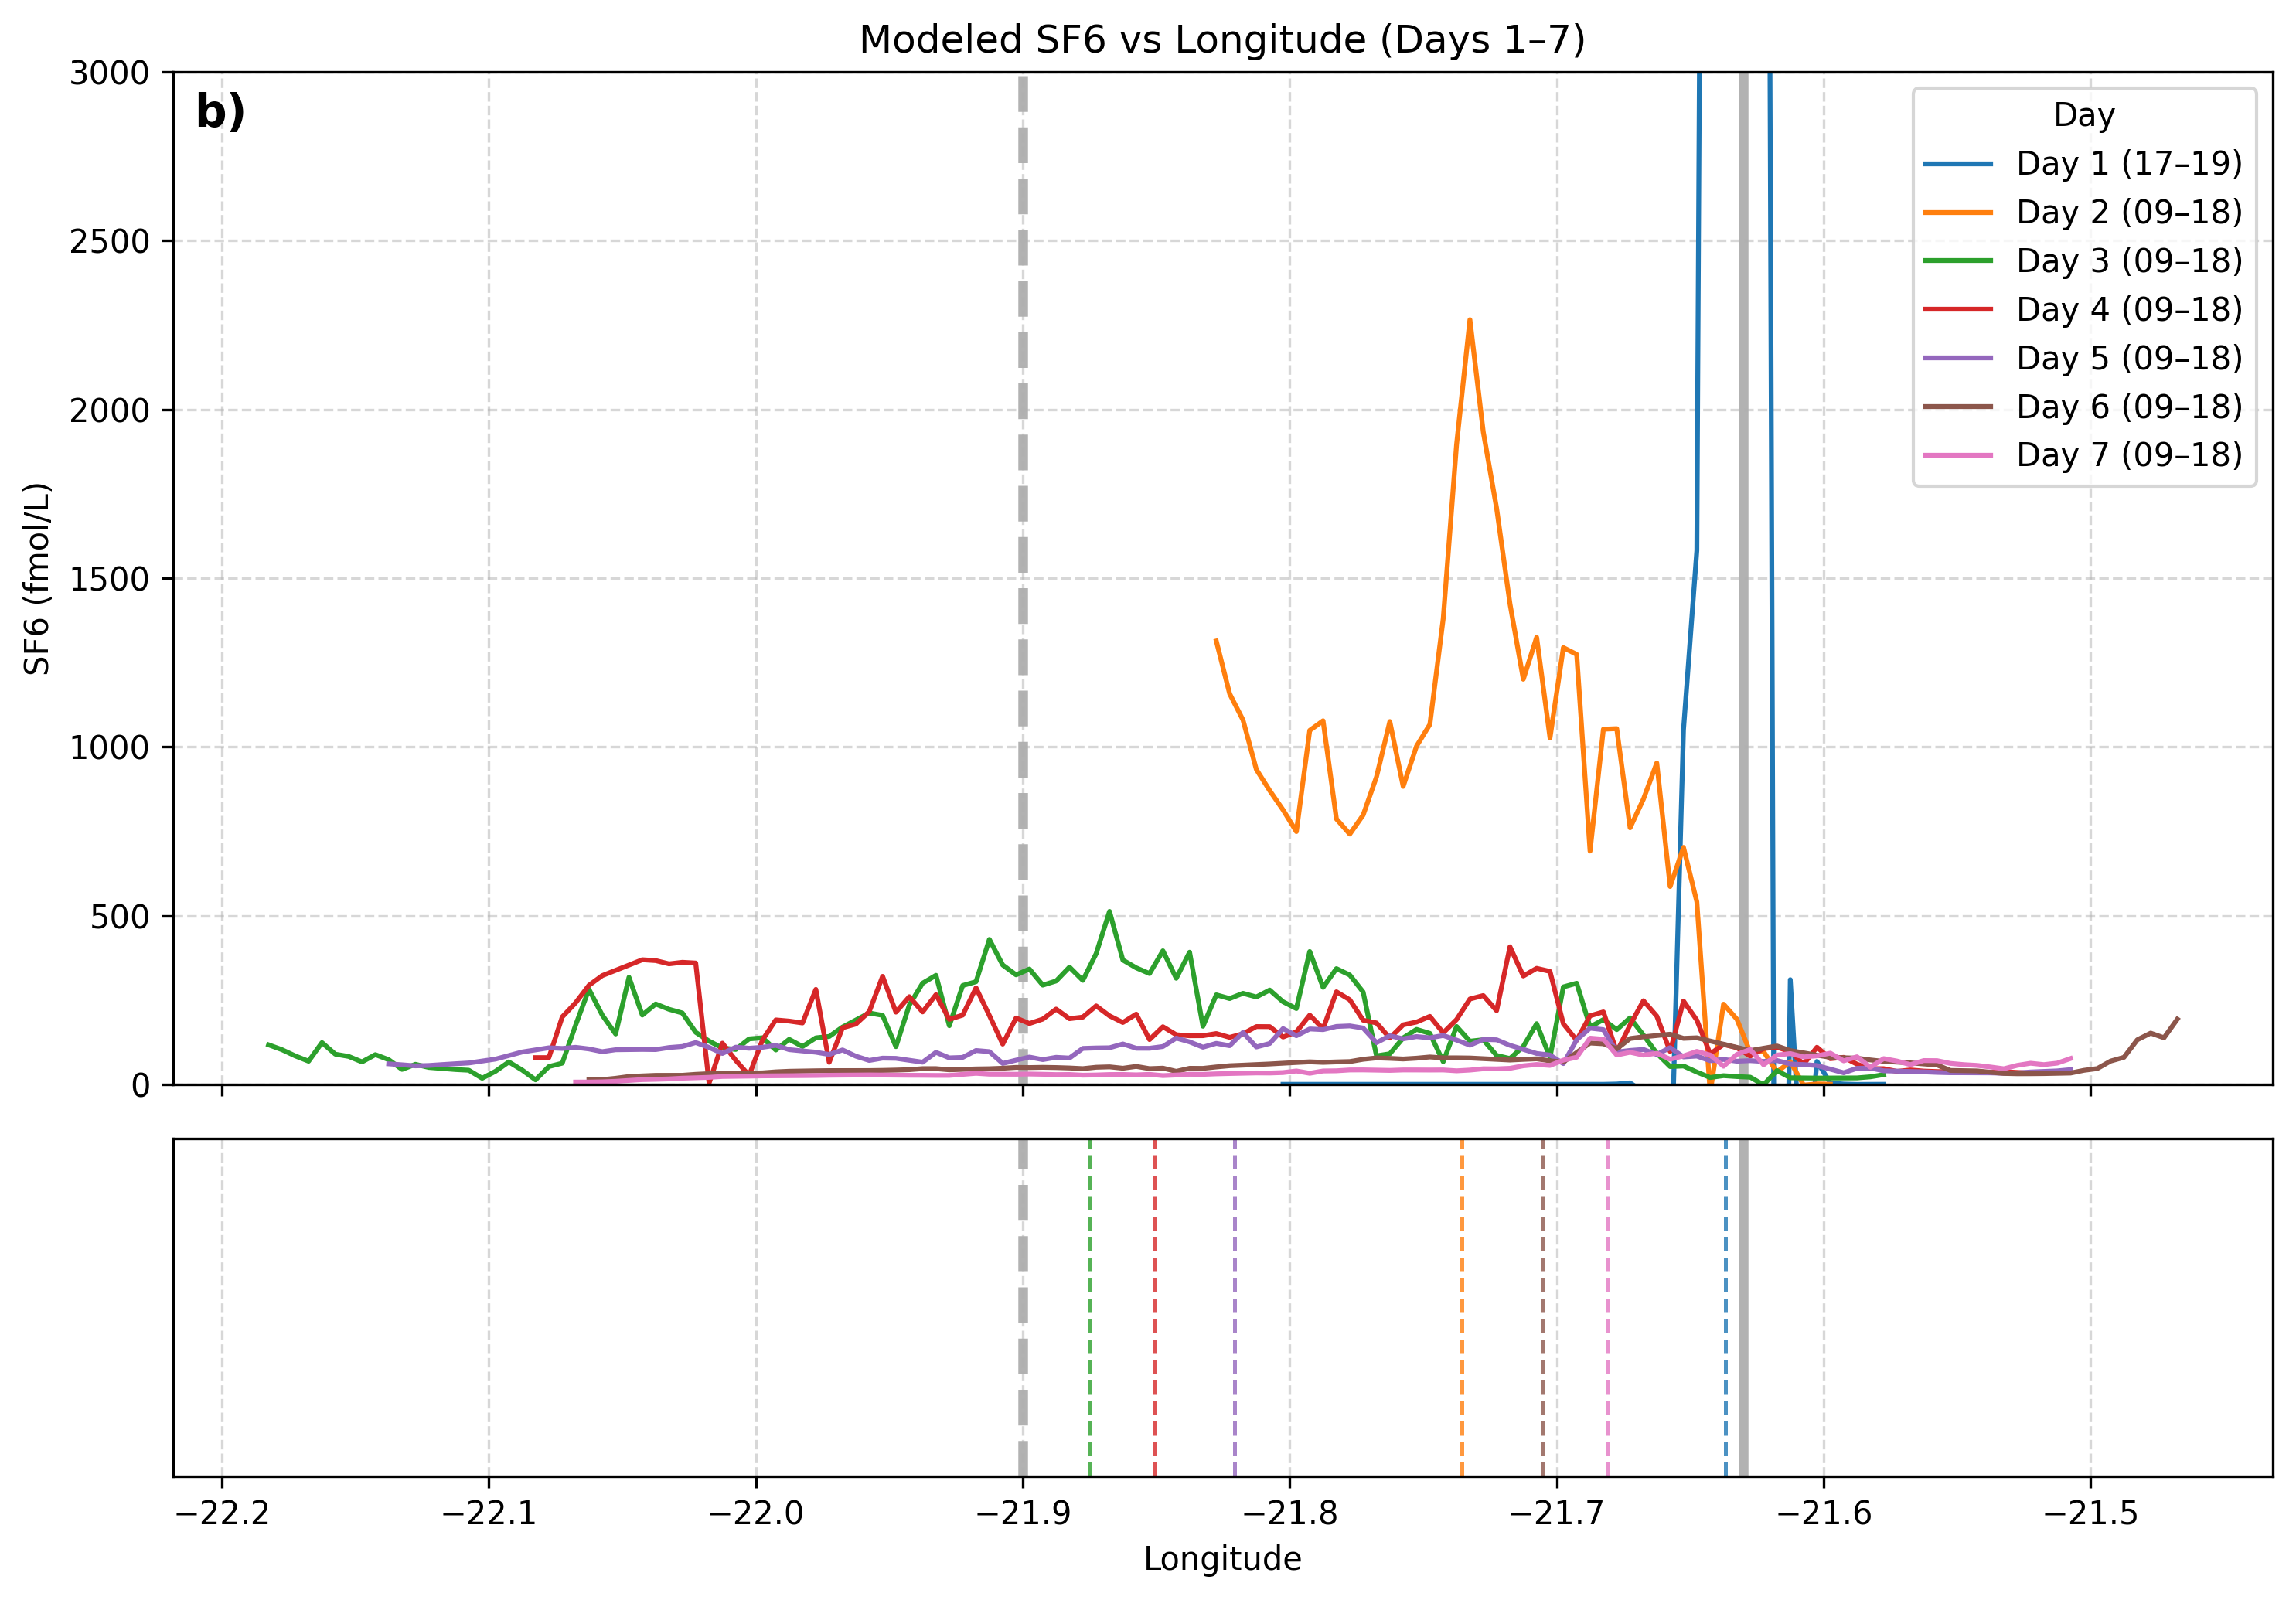
mouth_lon=-21.9
inj_lon=-21.63
# Precompute the mask
mask = roms_regrid(grid, grid['mask_rho'])
# Set up plotting
fig, (ax1, ax2) = plt.subplots(nrows=2, ncols=1, figsize=(10, 7), dpi=300,
sharex=True, gridspec_kw={'height_ratios': [3, 1]})
vmin, vmax = 1e-1, 5e4
for d, day in enumerate(unique_days[:num_days]):
# -----------------------
# Time masks
# -----------------------
day_mask = (day_index == day)
if d == 0:
hour_mask = (hour_of_day >= 17) & (hour_of_day < 19)
label = "Day 1 (17–19)"
else:
hour_mask = (hour_of_day >= 9) & (hour_of_day < 18)
label = f"Day {d+1} (09–18)"
time_mask = day_mask & hour_mask
# ✅ Convert boolean mask → integer indices
time_idx = np.where(time_mask.values)[0]
if len(time_idx) == 0:
continue
# -----------------------
# Average over time + depth
# -----------------------
x_day = (
x
.isel(time=time_idx)
.isel(s_rho=slice(50, 59))
.mean(dim=['time', 's_rho'])
)
dye = roms_regrid(grid, x_day['dye']).load()
dye=dye*scaling_factor
# -----------------------
# Extract locations
# -----------------------
clean_locs = locations_array[d, :, :]
locations = clean_locs[~np.isnan(clean_locs).any(axis=1)]
dye_values = []
lons = []
for lat, lon in locations:
val = (
dye
.sel(lat=lat, method='nearest')
.sel(lon=lon, method='nearest')
.values
* scaling_factor
)
dye_values.append(val)
lons.append(lon)
lons = np.array(lons) - 360
dye_values = np.array(dye_values)
# -----------------------
# Bin longitudes (0.05°)
# -----------------------
bin_width = 0.005
lon_min = np.floor(lons.min() / bin_width) * bin_width
lon_max = np.ceil(lons.max() / bin_width) * bin_width
bins = np.arange(lon_min, lon_max + bin_width, bin_width)
bin_centers = 0.5 * (bins[:-1] + bins[1:])
bin_idx = np.digitize(lons, bins) - 1
dye_binned = np.full(len(bin_centers), np.nan)
for i in range(len(bin_centers)):
in_bin = bin_idx == i
if np.any(in_bin):
dye_binned[i] = np.nanmean(dye_values[in_bin])
# -----------------------
# Remove NaNs
# -----------------------
valid = np.isfinite(dye_binned)
lon_valid = bin_centers[valid]
dye_valid = dye_binned[valid]
# -----------------------
# Compute mass-weighted median longitude
# -----------------------
cumulative = np.cumsum(dye_valid)
cumulative /= cumulative[-1] # normalize to [0, 1]
# Longitude where 50% of dye is to the west/east
lon_median = np.interp(0.5, cumulative, lon_valid)
# -----------------------
# Plot main line
# -----------------------
line, = ax1.plot(
lon_valid,
dye_valid,
'-',
linewidth=1.5,
label=label
)
line_color = line.get_color()
# -----------------------
# Plot mass-weighted median (same color, dashed)
# -----------------------
ax2.axvline(
lon_median,
linestyle='--',
linewidth=1.2,
color=line_color,
alpha=0.8
)
# Bottom Plot (Empty Box with Median Labels)
ax2.set_xlabel('Longitude')
ax2.set_ylabel('') # Hide ylabel
ax2.set_yticks([]) # Remove y-ticks
ax2.set_yticklabels([]) # Remove y-tick labels
ax2.grid(True, axis='x', linestyle='--', alpha=0.5)
# -----------------------
# Final formatting
# -----------------------
#ax1.set_xlabel('Longitude')
ax1.set_ylabel('SF6 (fmol/L)')
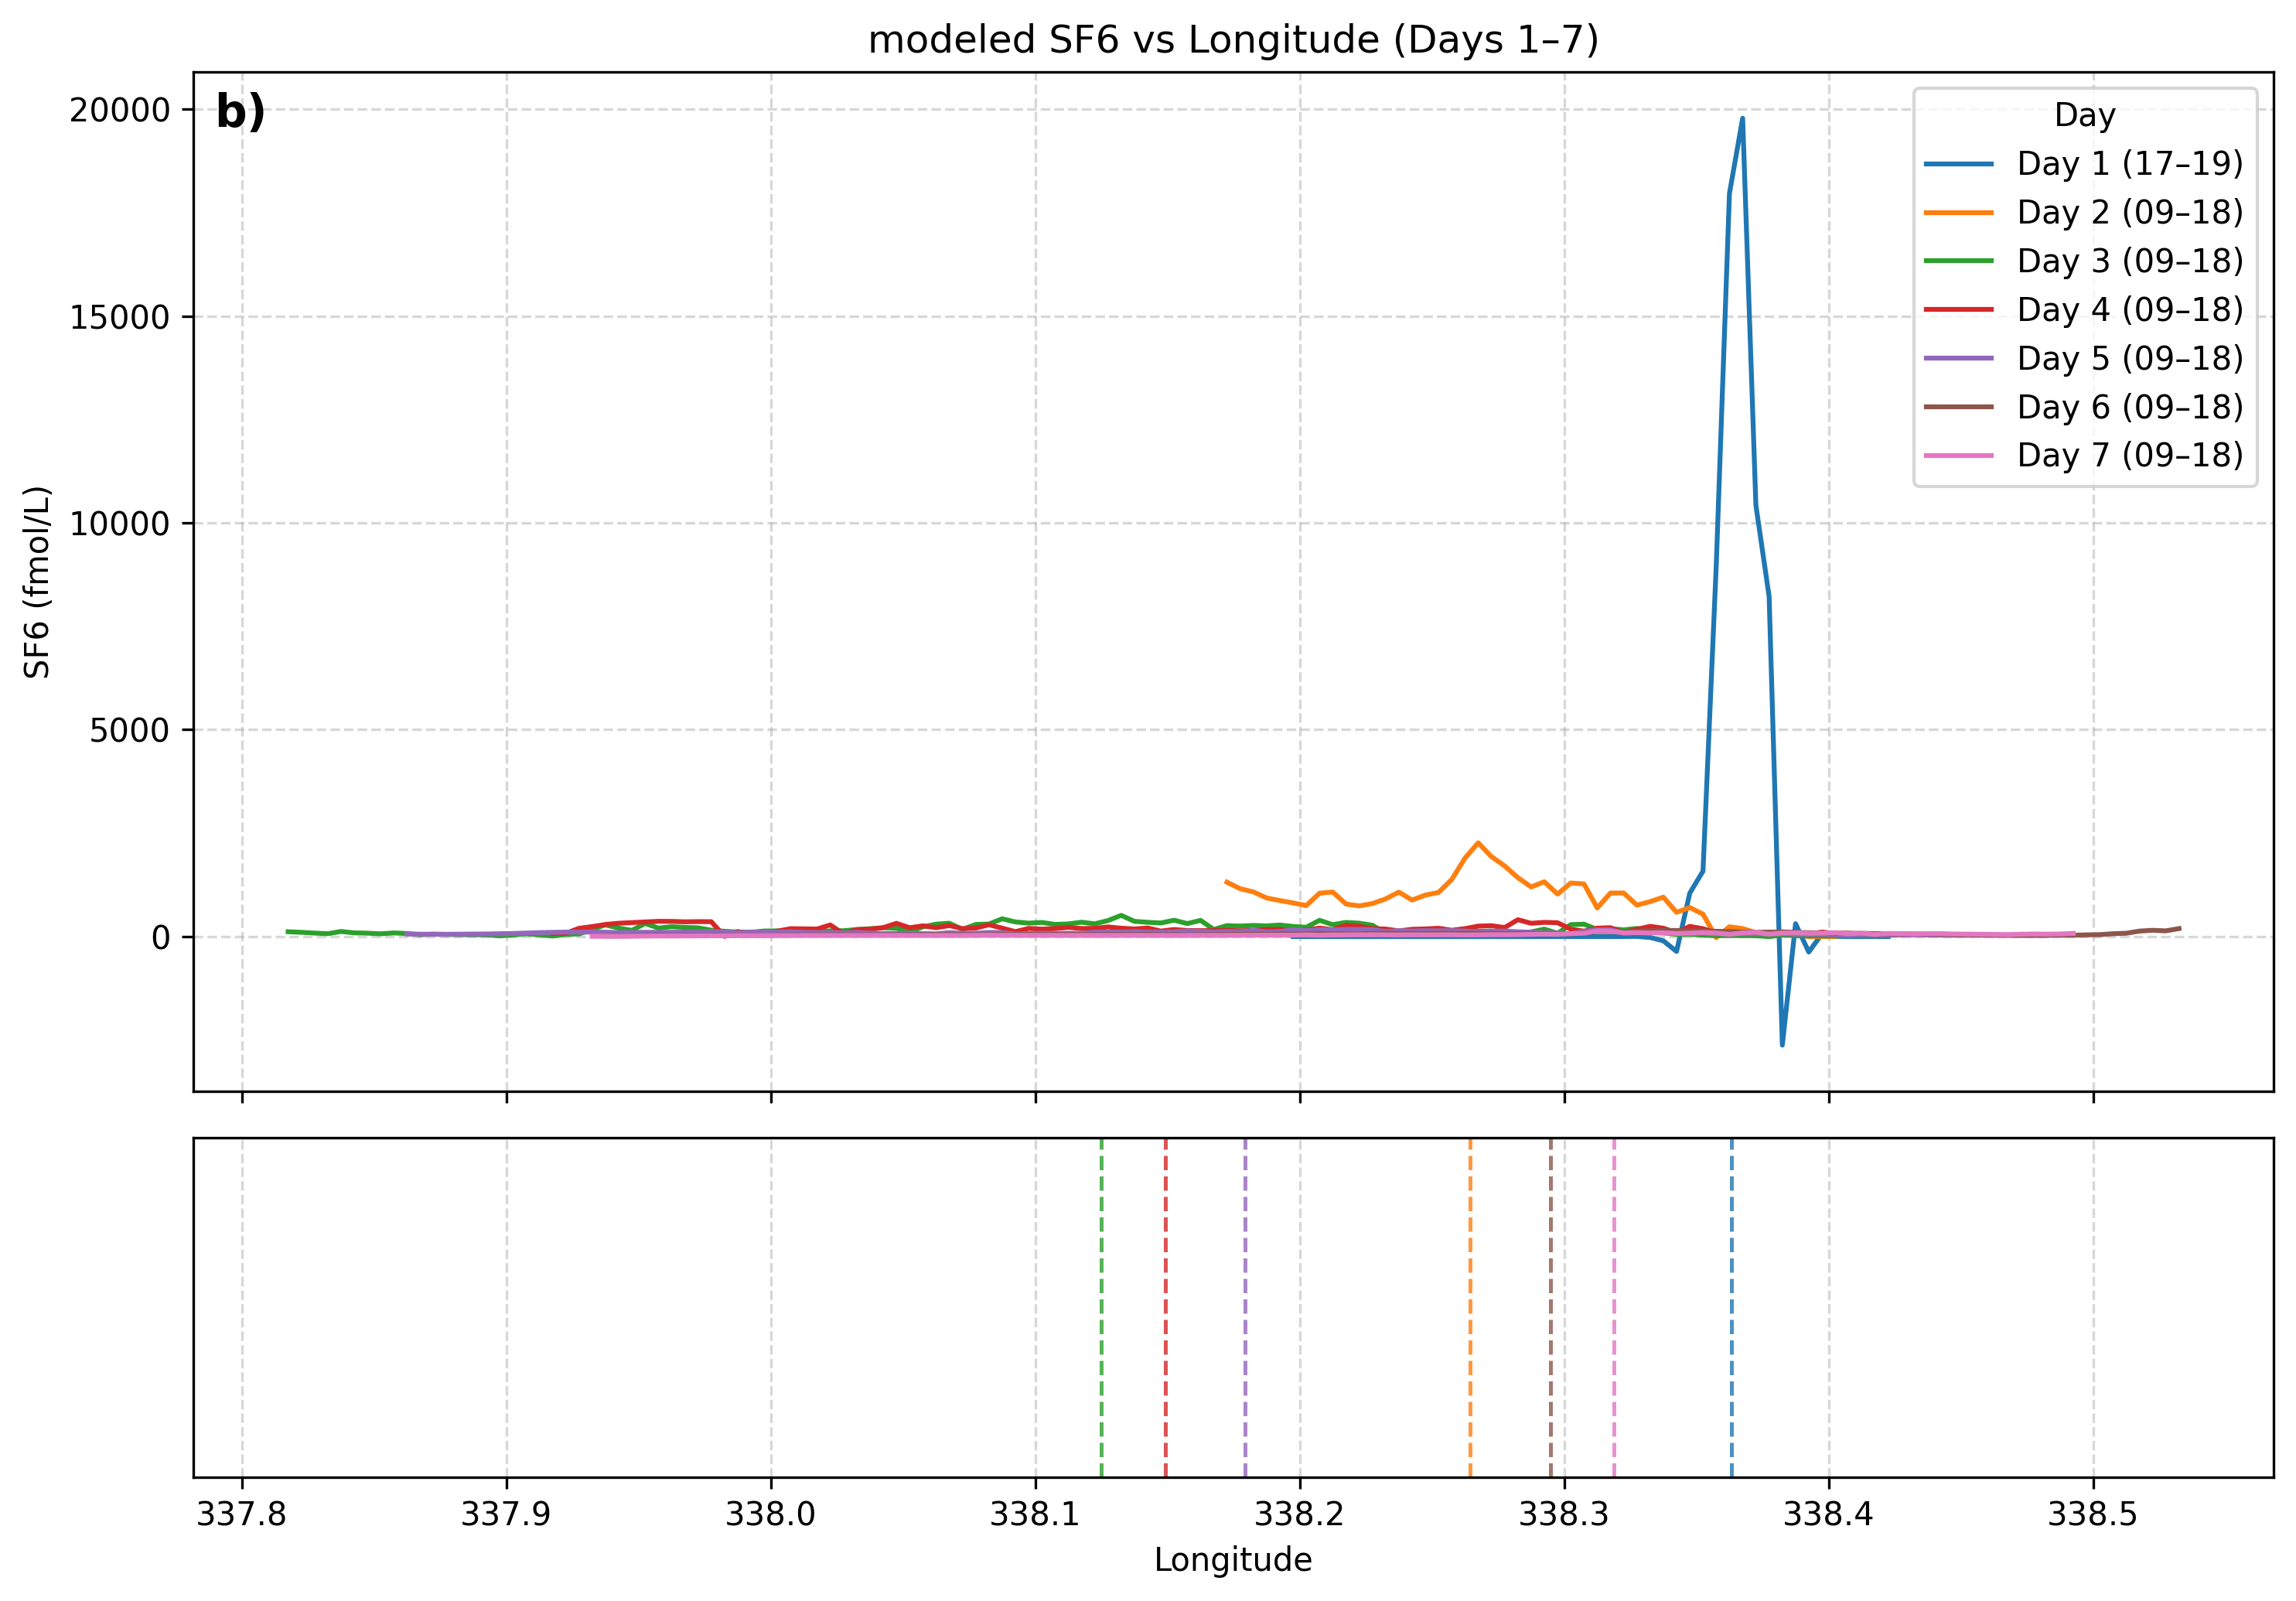
ax1.set_title('Modeled SF6 vs Longitude (Days 1–7)')
ax1.legend(title='Day')
ax1.grid(True, which='both', linestyle='--', alpha=0.5)
ax1.set_ylim([-1,3000])
# Panel label a)
ax1.text(
0.01, 0.98, "b)",
transform=ax1.transAxes,
fontsize=14,
fontweight="bold",
va="top",
ha="left"
)
for ax in [ax1, ax2]:
ax.axvline(mouth_lon, color='grey', linewidth=3,linestyle='--', alpha=0.6, zorder=0)
for ax in [ax1, ax2]:
ax.axvline(inj_lon, color='grey', linewidth=3, alpha=0.6, zorder=0)
plt.tight_layout()
plt.show()
/home/x-uheede/.local/lib/python3.11/site-packages/xarray/computation/apply_ufunc.py:310: PerformanceWarning: Regridding is increasing the number of chunks by a factor of 9.0, you might want to specify sizes in `output_chunks` in the regridder call. Default behaviour is to preserve the chunk sizes from the input (172, 172).
  result_var = func(*data_vars)
/home/x-uheede/.local/lib/python3.11/site-packages/xarray/computation/apply_ufunc.py:310: PerformanceWarning: Regridding is increasing the number of chunks by a factor of 9.0, you might want to specify sizes in `output_chunks` in the regridder call. Default behaviour is to preserve the chunk sizes from the input (172, 172).
  result_var = func(*data_vars)
/home/x-uheede/.local/lib/python3.11/site-packages/xarray/computation/apply_ufunc.py:310: PerformanceWarning: Regridding is increasing the number of chunks by a factor of 9.0, you might want to specify sizes in `output_chunks` in the regridder call. Default behaviour is to preserve the chunk sizes from the input (172, 172).
  result_var = func(*data_vars)
/home/x-uheede/.local/lib/python3.11/site-packages/xarray/computation/apply_ufunc.py:310: PerformanceWarning: Regridding is increasing the number of chunks by a factor of 9.0, you might want to specify sizes in `output_chunks` in the regridder call. Default behaviour is to preserve the chunk sizes from the input (172, 172).
  result_var = func(*data_vars)
/home/x-uheede/.local/lib/python3.11/site-packages/xarray/computation/apply_ufunc.py:310: PerformanceWarning: Regridding is increasing the number of chunks by a factor of 9.0, you might want to specify sizes in `output_chunks` in the regridder call. Default behaviour is to preserve the chunk sizes from the input (172, 172).
  result_var = func(*data_vars)
/home/x-uheede/.local/lib/python3.11/site-packages/xarray/computation/apply_ufunc.py:310: PerformanceWarning: Regridding is increasing the number of chunks by a factor of 9.0, you might want to specify sizes in `output_chunks` in the regridder call. Default behaviour is to preserve the chunk sizes from the input (172, 172).
  result_var = func(*data_vars)
/home/x-uheede/.local/lib/python3.11/site-packages/xarray/computation/apply_ufunc.py:310: PerformanceWarning: Regridding is increasing the number of chunks by a factor of 9.0, you might want to specify sizes in `output_chunks` in the regridder call. Default behaviour is to preserve the chunk sizes from the input (172, 172).
  result_var = func(*data_vars)
import matplotlib.pyplot as plt
import numpy as np
import xarray as xr
scaling_factor=97.09

x = xr.open_mfdataset(
    '/home/x-uheede/S/Iceland2_NOMARBL_2024_DYE_2/Iceland2_MARBL_2024_his.202407????????.nc',
    combine='nested',
    concat_dim=["time"]
)

# open grid
grid = xr.open_mfdataset(
    '/home/x-uheede/S/Iceland2_NOMARBL_2024_DYE_2/P_INPUT/Iceland2_grid.nc'
)

# Constants
hours_per_day = 24
num_days = 7

# Precompute the mask
mask = roms_regrid(grid, grid['mask_rho'])

# Set up plotting
fig, (ax1, ax2) = plt.subplots(nrows=2, ncols=1, figsize=(10, 7), dpi=300,
                               sharex=True, gridspec_kw={'height_ratios': [3, 1]})
vmin, vmax = 1e-1, 5e4

for d, day in enumerate(unique_days[:num_days]):

    # -----------------------
    # Time masks
    # -----------------------
    day_mask = (day_index == day)

    if d == 0:
        hour_mask = (hour_of_day >= 17) & (hour_of_day < 19)
        label = "Day 1 (17–19)"
    else:
        hour_mask = (hour_of_day >= 9) & (hour_of_day < 18)
        label = f"Day {d+1} (09–18)"

    time_mask = day_mask & hour_mask

    # ✅ Convert boolean mask → integer indices
    time_idx = np.where(time_mask.values)[0]

    if len(time_idx) == 0:
        continue

    # -----------------------
    # Average over time + depth
    # -----------------------
    x_day = (
        x
        .isel(time=time_idx)
        .isel(s_rho=slice(50, 59))
        .mean(dim=['time', 's_rho'])
    )

    dye = roms_regrid(grid, x_day['dye']).load()
    dye=dye*scaling_factor
    # -----------------------
    # Extract locations
    # -----------------------
    clean_locs = locations_array[d, :, :]
    locations = clean_locs[~np.isnan(clean_locs).any(axis=1)]

    dye_values = []
    lons = []

    for lat, lon in locations:
        val = (
            dye
            .sel(lat=lat, method='nearest')
            .sel(lon=lon, method='nearest')
            .values
            * scaling_factor
        )
        dye_values.append(val)
        lons.append(lon)

    lons = np.array(lons)
    dye_values = np.array(dye_values)

    # -----------------------
    # Bin longitudes (0.05°)
    # -----------------------
    bin_width = 0.005
    lon_min = np.floor(lons.min() / bin_width) * bin_width
    lon_max = np.ceil(lons.max() / bin_width) * bin_width

    bins = np.arange(lon_min, lon_max + bin_width, bin_width)
    bin_centers = 0.5 * (bins[:-1] + bins[1:])
    bin_idx = np.digitize(lons, bins) - 1

    dye_binned = np.full(len(bin_centers), np.nan)

    for i in range(len(bin_centers)):
        in_bin = bin_idx == i
        if np.any(in_bin):
            dye_binned[i] = np.nanmean(dye_values[in_bin])

    # -----------------------
    # Remove NaNs
    # -----------------------
    valid = np.isfinite(dye_binned)
    lon_valid = bin_centers[valid]
    dye_valid = dye_binned[valid]

    # -----------------------
    # Compute mass-weighted median longitude
    # -----------------------
    cumulative = np.cumsum(dye_valid)
    cumulative /= cumulative[-1]  # normalize to [0, 1]

    # Longitude where 50% of dye is to the west/east
    lon_median = np.interp(0.5, cumulative, lon_valid)

    # -----------------------
    # Plot main line
    # -----------------------
    line, = ax1.plot(
        lon_valid,
        dye_valid,
        '-',
        linewidth=1.5,
        label=label
    )

    line_color = line.get_color()

    # -----------------------
    # Plot mass-weighted median (same color, dashed)
    # -----------------------
    ax2.axvline(
        lon_median,
        linestyle='--',
        linewidth=1.2,
        color=line_color,
        alpha=0.8
    )


# Bottom Plot (Empty Box with Median Labels)
ax2.set_xlabel('Longitude')
ax2.set_ylabel('')           # Hide ylabel
ax2.set_yticks([])           # Remove y-ticks
ax2.set_yticklabels([])      # Remove y-tick labels
ax2.grid(True, axis='x', linestyle='--', alpha=0.5)

# -----------------------
# Final formatting
# -----------------------
#ax1.set_xlabel('Longitude')
ax1.set_ylabel('SF6 (fmol/L)')
ax1.set_title('modeled SF6 vs Longitude (Days 1–7)')
ax1.legend(title='Day')
ax1.grid(True, which='both', linestyle='--', alpha=0.5)
#ax1.set_ylim([-1,3000])
# Panel label a)
ax1.text(
    0.01, 0.98, "b)",
    transform=ax1.transAxes,
    fontsize=14,
    fontweight="bold",
    va="top",
    ha="left"
)
plt.tight_layout()
plt.show()
/home/x-uheede/.local/lib/python3.11/site-packages/xarray/computation/apply_ufunc.py:310: PerformanceWarning: Regridding is increasing the number of chunks by a factor of 9.0, you might want to specify sizes in `output_chunks` in the regridder call. Default behaviour is to preserve the chunk sizes from the input (172, 172).
  result_var = func(*data_vars)
/home/x-uheede/.local/lib/python3.11/site-packages/xarray/computation/apply_ufunc.py:310: PerformanceWarning: Regridding is increasing the number of chunks by a factor of 9.0, you might want to specify sizes in `output_chunks` in the regridder call. Default behaviour is to preserve the chunk sizes from the input (172, 172).
  result_var = func(*data_vars)
/home/x-uheede/.local/lib/python3.11/site-packages/xarray/computation/apply_ufunc.py:310: PerformanceWarning: Regridding is increasing the number of chunks by a factor of 9.0, you might want to specify sizes in `output_chunks` in the regridder call. Default behaviour is to preserve the chunk sizes from the input (172, 172).
  result_var = func(*data_vars)
/home/x-uheede/.local/lib/python3.11/site-packages/xarray/computation/apply_ufunc.py:310: PerformanceWarning: Regridding is increasing the number of chunks by a factor of 9.0, you might want to specify sizes in `output_chunks` in the regridder call. Default behaviour is to preserve the chunk sizes from the input (172, 172).
  result_var = func(*data_vars)
/home/x-uheede/.local/lib/python3.11/site-packages/xarray/computation/apply_ufunc.py:310: PerformanceWarning: Regridding is increasing the number of chunks by a factor of 9.0, you might want to specify sizes in `output_chunks` in the regridder call. Default behaviour is to preserve the chunk sizes from the input (172, 172).
  result_var = func(*data_vars)
/home/x-uheede/.local/lib/python3.11/site-packages/xarray/computation/apply_ufunc.py:310: PerformanceWarning: Regridding is increasing the number of chunks by a factor of 9.0, you might want to specify sizes in `output_chunks` in the regridder call. Default behaviour is to preserve the chunk sizes from the input (172, 172).
  result_var = func(*data_vars)
/home/x-uheede/.local/lib/python3.11/site-packages/xarray/computation/apply_ufunc.py:310: PerformanceWarning: Regridding is increasing the number of chunks by a factor of 9.0, you might want to specify sizes in `output_chunks` in the regridder call. Default behaviour is to preserve the chunk sizes from the input (172, 172).
  result_var = func(*data_vars)